ICLR 2026

Detecting Data Contamination in LLMs via In-Context Learning

A simple, accurate method that reveals what your LLM has already memorized—by measuring how in-context examples change its confidence.

Michał Zawalski, Meriem Boubdir, Klaudia Bałazy, Besmira Nushi, Pablo Ribalta
NVIDIA

Read Paper Code Leaderboard

Do You Trust Benchmark Scores?

When a model scores 95% on a benchmark, how much of that is genuine reasoning versus memorized answers? As LLMs train on ever-larger web corpora, popular benchmarks inevitably leak into training data. This data contamination silently inflates reported performance, making fair model comparison impossible.

Existing detection methods require access to training data, need extensive parameter tuning per model, or fail to produce reliable, interpretable results at scale.

We need a method that works with any model, any dataset, automatically.

60+
Models evaluated
20+
Benchmarks tested
99.9%
Dataset-level AUC

The Key Insight

Models respond differently to in-context examples depending on whether they have already memorized the data.

Unseen Data

When a model hasn't seen a dataset, in-context examples from the same distribution provide useful patterns—new stylistic cues, vocabulary, and structure. The model's confidence on target samples increases.

Confidence increases for unseen data when context is added

Memorized Data

When a model has memorized a dataset, it has already internalized all its patterns. Adding more examples disrupts memorization, and the model's confidence decreases.

Confidence decreases for memorized data when context is added

CoDeC measures this difference. The fraction of samples where confidence drops when context is added = the contamination score.

The IMO Analogy

Consider a mathematician preparing for the International Mathematical Olympiad. If they trained exclusively on past IMO problems, they would internalize IMO-specific patterns—certain proof structures, problem styles, implicit assumptions. Giving them more IMO problems as reference during the competition wouldn't help; they've already memorized those patterns. But a mathematician with broad training who has never seen IMO problems would benefit greatly from the same reference material. CoDeC exploits exactly this asymmetry.

How CoDeC Works

Four simple steps. Two forward passes. One clear answer.

1
Baseline

Compute the model's average log-likelihood on target tokens without any context.

2
In-Context

Prepend random samples from the same dataset and measure the model's predictions again.

3
Compare

Compute for each sample.

4
Aggregate

The contamination score is the fraction of samples where Δ < 0 (confidence dropped).

Pipeline Overview

CoDeC pipeline overview diagram

For each dataset element, CoDeC augments the context with samples from the same dataset. A decrease in the model's logits indicates potential contamination. The overall contamination level is estimated as the fraction of samples exhibiting this effect.

Why It Works

The effectiveness of CoDeC stems from several intuitive principles.

Dataset-Specific Priors

Models trained on a dataset internalize its unique style, vocabulary, and implicit assumptions. If these priors are already memorized, additional in-context examples add little useful information.

Context Disrupts Memorization

For contaminated data, adding memorized in-context examples interferes with the model's memorized token sequences. The context triggers conflicting patterns, reducing confidence.

ICL Mirrors Finetuning

Contaminated models resemble finetuned models near saturation—additional training yields minimal gains. CoDeC effectively measures the remaining learning capacity for the target dataset.

Loss Landscape Geometry

Memorized samples sit in narrow, sharp local minima. Even small perturbations (like adding context) destabilize predictions. Unseen data occupies flatter regions that benefit from additional context.

Experimental Validation

Controlled experiments confirm that CoDeC reliably detects contamination.

CoDeC vs. Baselines

We evaluate CoDeC on models with publicly available training data. CoDeC achieves 99.9% dataset-level AUC, cleanly separating seen from unseen data. Baselines (Vanilla Loss, Min-K%, Zlib Ratio) fail to provide reliable separation.

Box plots comparing CoDeC vs baseline methods

Contamination scores for training (red) and unseen (blue) datasets. Each point is a model–dataset pair.

Finetuning Validation

Finetuning any model on a dataset reliably pushes CoDeC scores toward 100%, consistently across four different architectures. This controlled experiment confirms that CoDeC accurately tracks the introduction of contamination, even for models without public training data.

CoDeC scores approach 100% during finetuning across architectures

Properties & Analysis

Understanding the behavior, robustness, and practical characteristics of CoDeC.

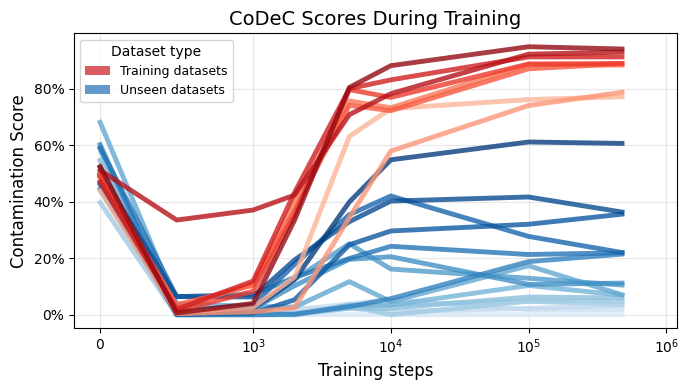
Early Detection During Training

Tracking CoDeC scores across OLMo 7B training checkpoints, we find that scores reach their final values after just 2% of training (10k out of 477k steps). This enables early intervention during model development, before significant training resources are spent.

CoDeC scores during OLMo 7B training

CoDeC Scores Depend on Data, Not Model Specifics

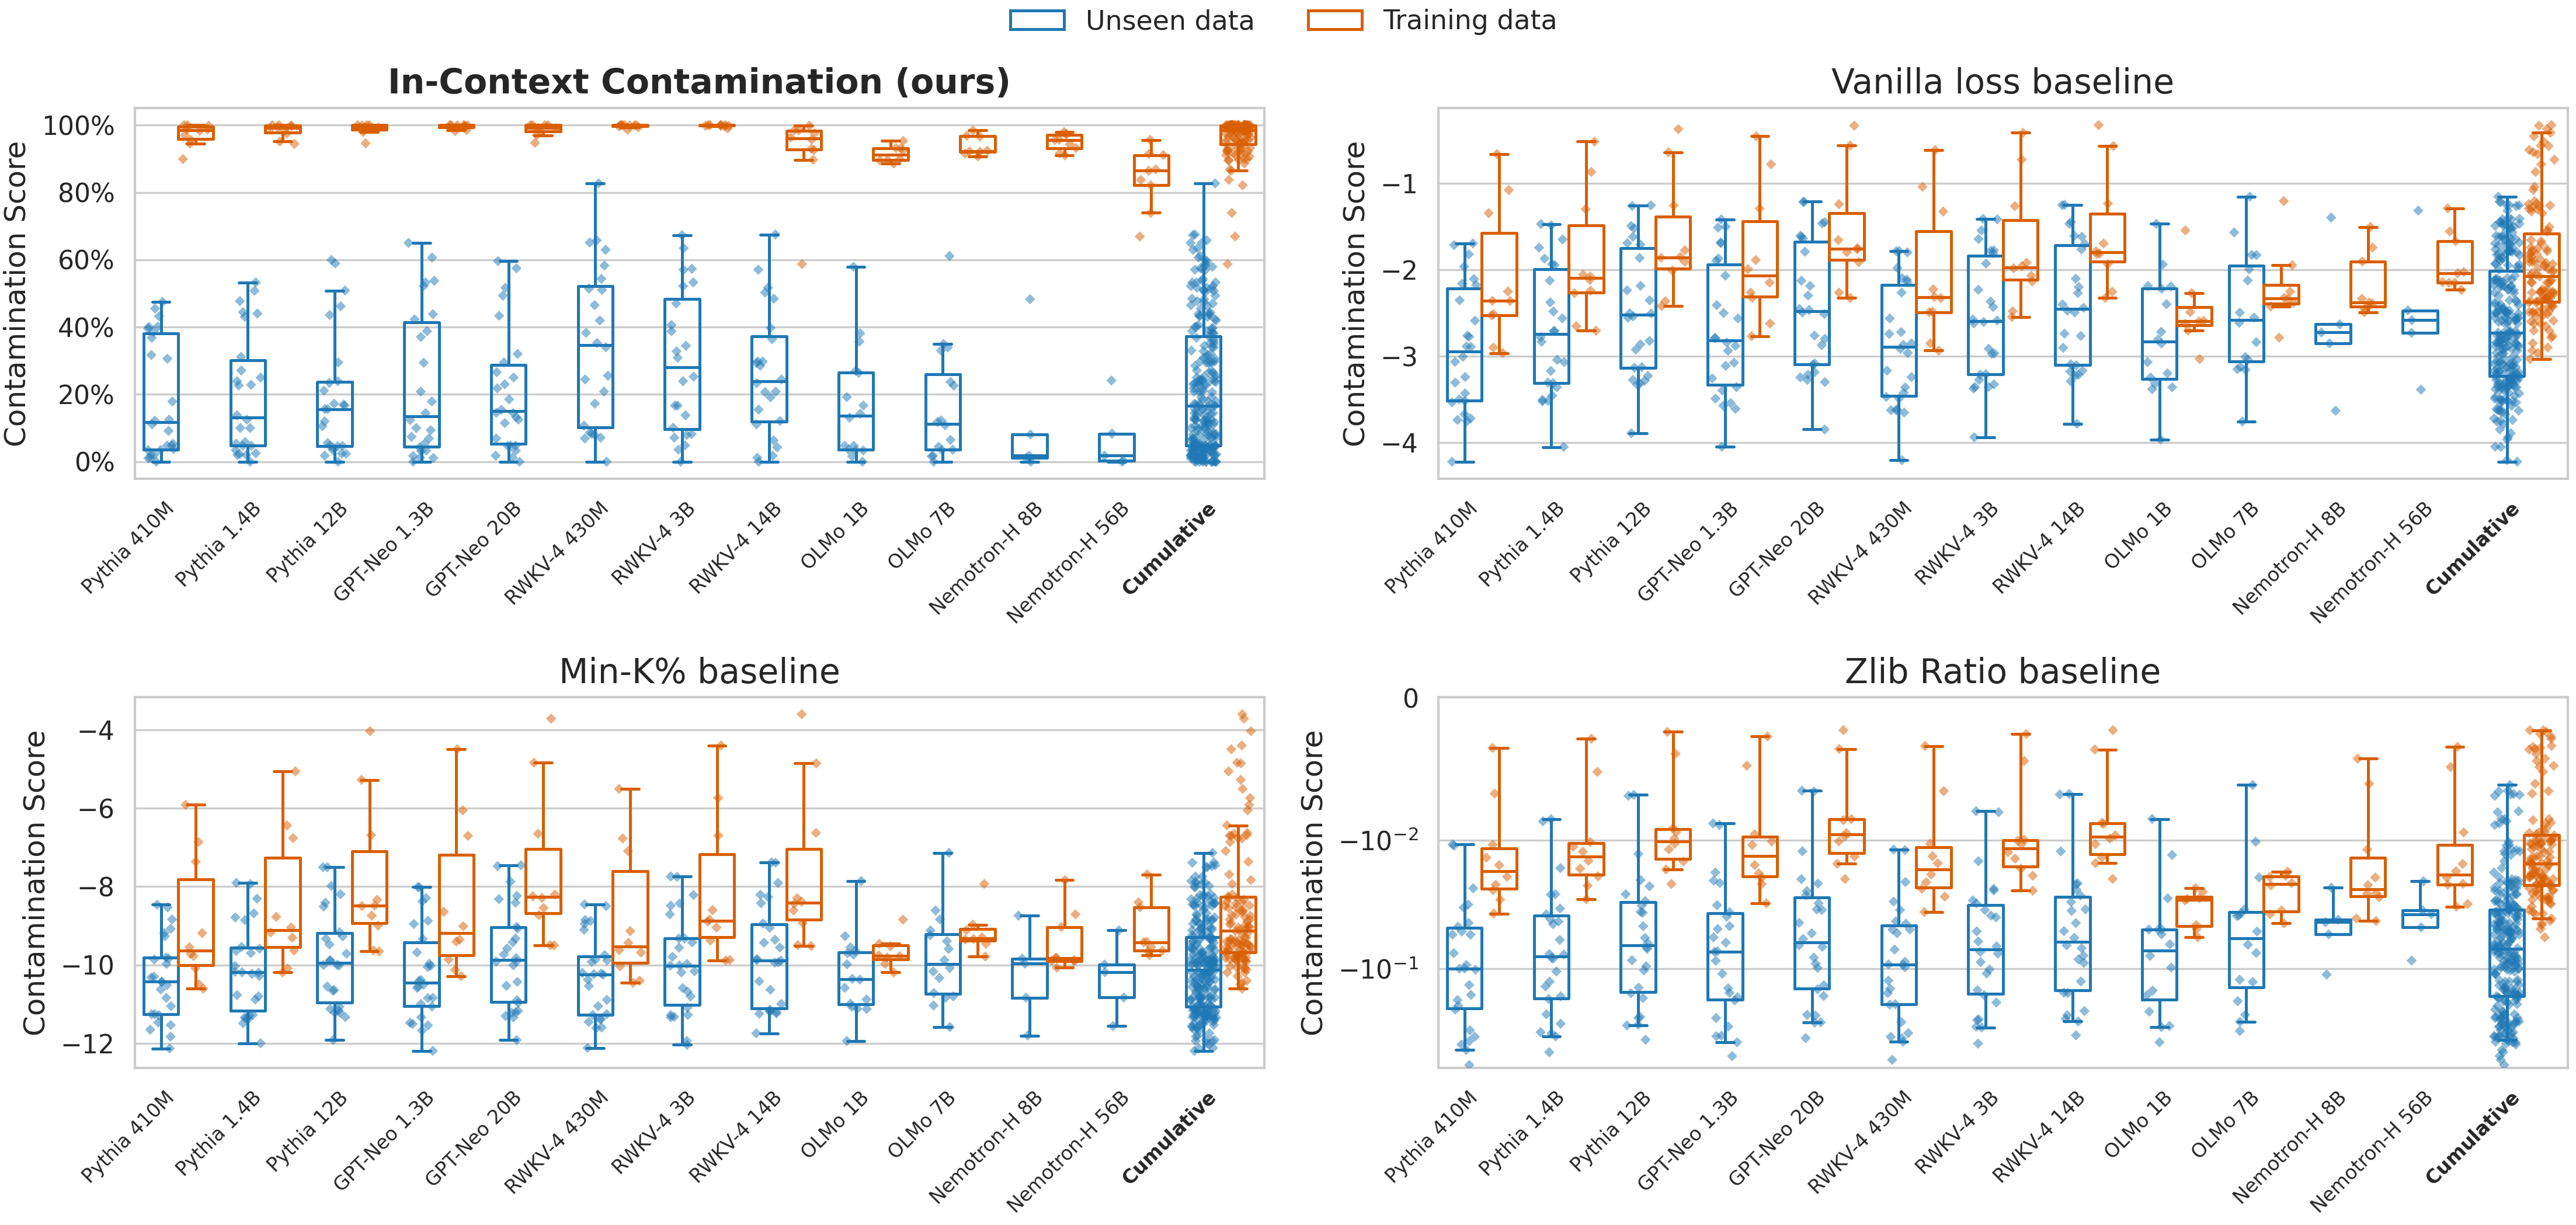
CoDeC scores are primarily determined by the relationship between the training corpus and the target benchmark. For models trained on the same data (e.g., the Pile), scores for each dataset are narrowly distributed. This stability enables meaningful cross-model comparisons: consistent scores reflect a dataset-level property, while deviations signal model-specific memorization.

Distribution of CoDeC scores per dataset across models

CoDeC scores for models trained on the Pile. The last 10 datasets are parts of the training data. Scores usually cluster around a dataset-specific mean.

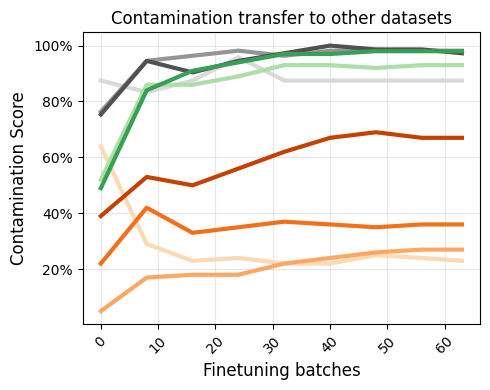
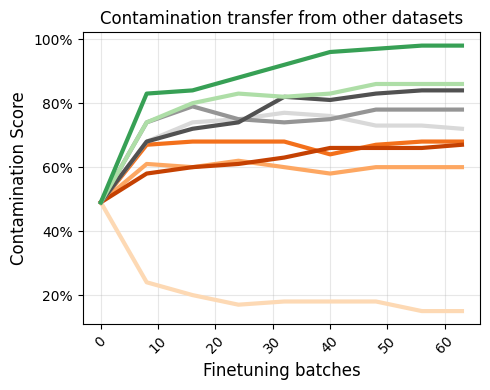
Contamination Transfer

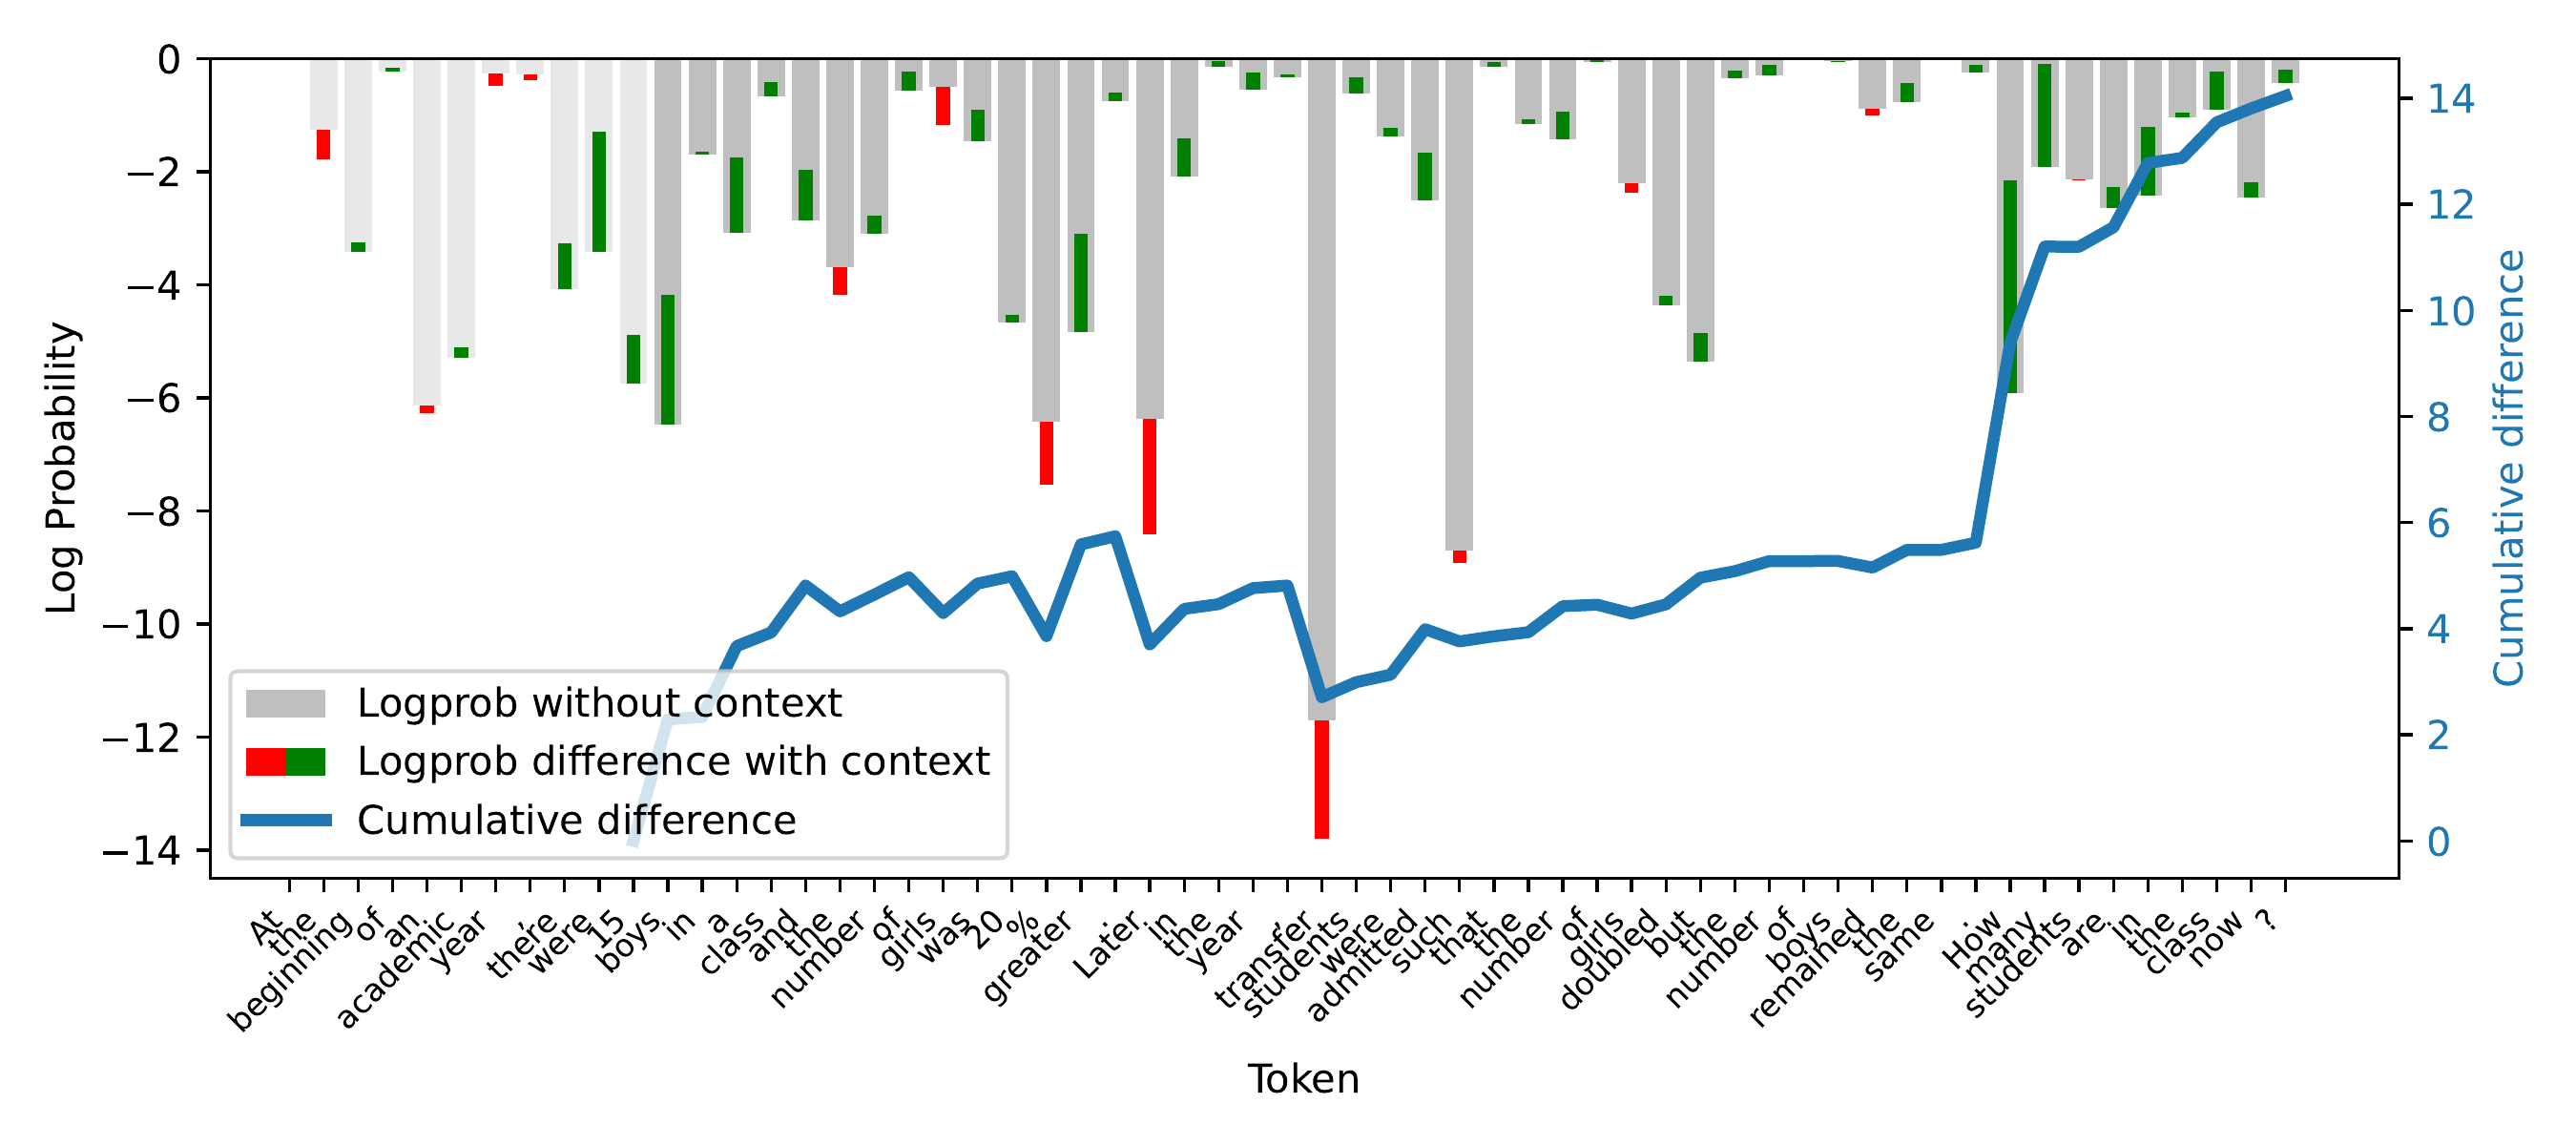
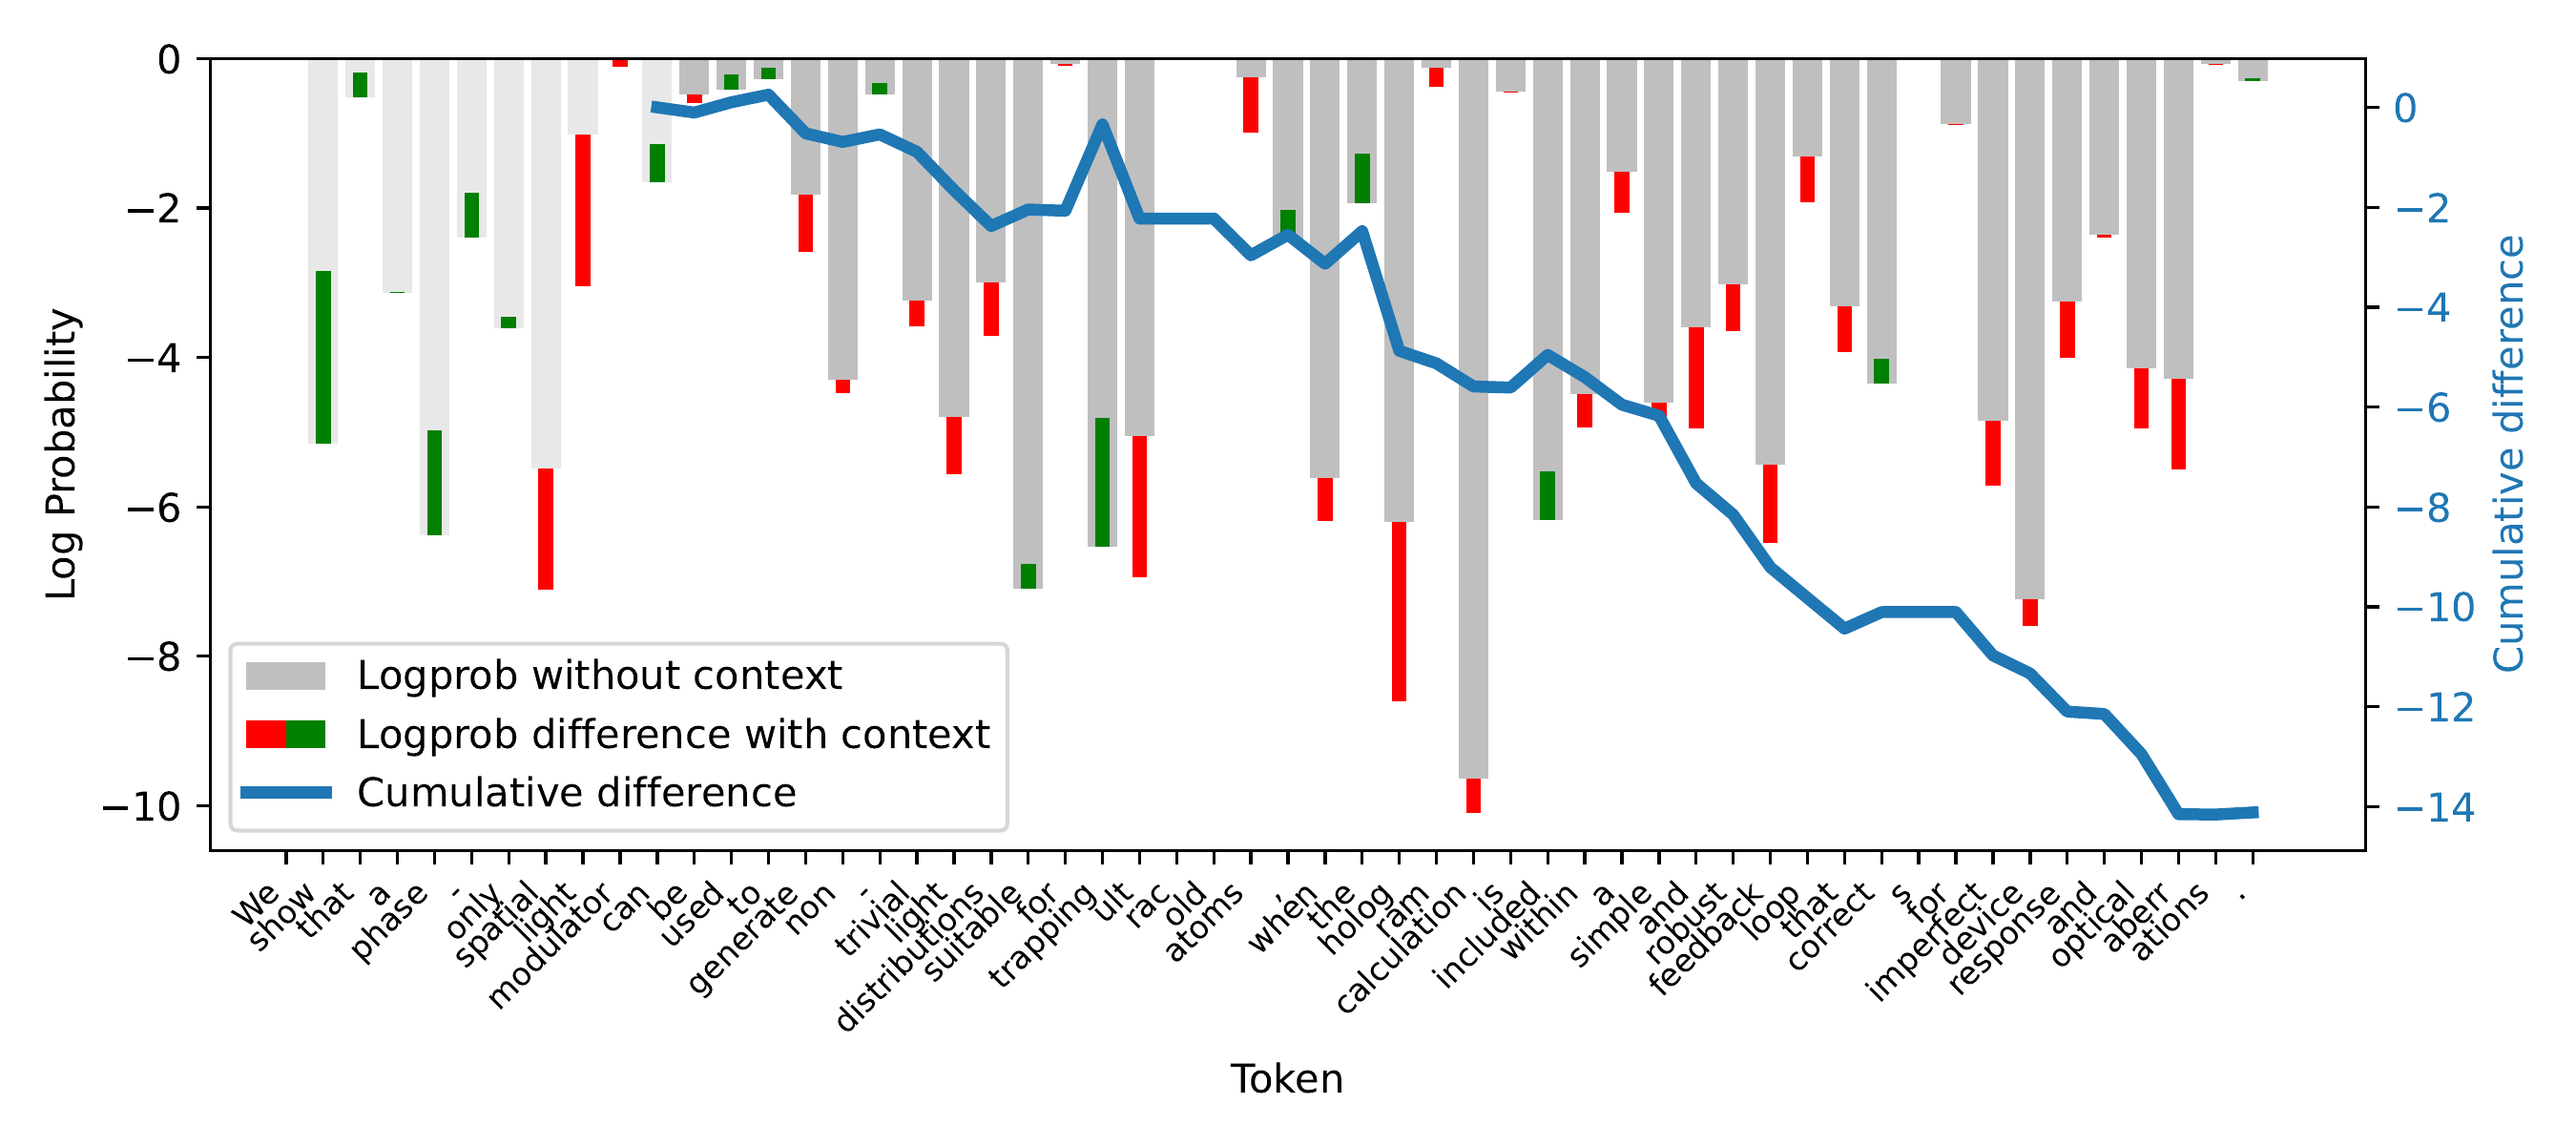
CoDeC detects indirect contamination from rephrased, augmented, or otherwise related data. The model becomes contaminated with MMLU even when trained on questions that were unseen, highly cropped, rephrased, noised, or highly related. This cannot be captured by simple n-gram overlap checks.

Contamination transfer to other datasets Contamination transfer from other datasets Legend

In-Context Learning Mirrors Finetuning

Adding in-context samples and finetuning with a moderate learning rate produce nearly identical confidence curves. For unseen data, both increase confidence with dimnishing gains; for training data, both decrease it in the first step, but then slowly increase it again. This pattern is due to the high variability of local minima in the loss landscape. This explains why CoDeC works: it measures the same underlying phenomenon as actual training—the remaining learning capacity for the target distribution—but at negligible computational cost.

Model confidence changes with growing context Model confidence changes during finetuning

Left: confidence change as in-context samples are added. Right: confidence change during finetuning at various learning rates. The curves are strikingly similar.

Sample Efficiency

CoDeC yields stable estimates with as few as 100 samples, and variance drops below 1% with 1,000 samples. The method requires only two forward passes per sample, is model-agnostic, dataset-agnostic, and parameter-free—no thresholds to tune, no reference models needed.

Contamination scores remain stable with as few as 100 samples

Verifying Decontamination Claims

CoDeC can independently verify decontamination procedures described in technical reports. For example, Qwen 2.5 scores 100% contamination on GSM8K's training set but only 27% on the test set. According to its technical report, training set of GSM8K was deliberately included in training, but with questions overlapping the test set removed. CoDeC confirms both the deliberate inclusion and the successful decontamination—without requiring access to the training data or any prior knowledge of the data curation process.

Applications

CoDeC enables a range of practical use cases for improving LLM evaluation and development.

Fair Benchmark Evaluation

Identify when reported scores may be inflated by training data leakage, enabling more trustworthy performance comparisons.

Model Auditing

Verify training data claims for open-weight models. CoDeC works even when training corpora are undisclosed, requiring only gray-box access.

Training Quality Control

Detect accidental benchmark inclusion during data curation. CoDeC identifies contamination after just 2% of training, enabling early intervention.

Informed Model Comparison

Among models with similar benchmark accuracy, those with lower CoDeC scores should generalize better. CoDeC separates genuine capability from memorization.

Partial Contamination Detection

Catch indirect leakage from related, augmented, or synthetically generated data—contamination that n-gram overlap checks miss.

Interpreting CoDeC Scores

CoDeC scores measure how strongly a model's predictions depend on memorized patterns rather than genuine reasoning.

High (>80%)

Strong evidence of contamination. The model has likely been trained directly on this dataset or very closely related data. Benchmark results on this dataset should be interpreted with caution.

Moderate (40–80%)

Ambiguous range. May indicate partial contamination, training on closely related data, or a low-diversity dataset. Compare across models on the same benchmark to identify outliers.

Low (<40%)

No evidence of contamination. The model is likely reasoning based on general knowledge rather than memorized patterns. Benchmark results can be trusted with higher confidence.

Best Practices

  • Compare across models. Absolute scores are informative, but the most meaningful analysis compares a model's score against the distribution from other models on the same benchmark. Outliers relative to peers are stronger signals than absolute numbers alone.
  • Use reference models. Including at least one model known to be non-contaminated (e.g., an older model predating the benchmark) establishes a dataset-specific baseline. Prefer models of similar size.
  • Consider dataset diversity. Highly diverse datasets (e.g., MMLU with many unrelated topics) may yield moderate scores even without contamination, because unrelated context acts as noise.
  • Choose what to evaluate carefully. Use only the parts of a benchmark known to appear during training (typically just the questions, not evaluation-specific labels or templates). Arbitrary formatting choices—such as answer labels, instruction prompts, etc.—can significantly bias scores if they weren't part of the original training data.
  • CoDeC measures familiarity. A high score doesn't necessarily mean inflated accuracy—the model may recognize the question format without having seen the answers, or specific details (like numbers used) may differ from training examples.
  • Contamination is not inherently negative. A high contamination score on a benchmark means that accuracy on that benchmark may not generalize to other tasks. The model itself may still be highly capable—but its performance on that specific benchmark should not be taken as evidence of broader ability.

Contamination Leaderboard

We evaluated 60+ recent models across 20+ popular benchmarks. Explore the full results interactively.

Model HLE LiveCodeBench v5 SWE-Bench (test) GPQA Diamond MMLU-Pro AIME 2024
Llama-4-Scout-17B-16E-Instruct 88% 87% 77% 76% 49% 21%
MiniMax-M2.7 87% 81% 61% 50% 57% 27%
GLM-4.7 79% 56% 61% 46% 43% 64%
GLM-4.6 84% 71% 54% 45% 45% 59%
Phi-4-reasoning-plus 58% 42% 43% 38% 52% 86%
Llama-4-Maverick-17B-128E-Instruct 51% 36% 69% 55% 53% 22%
Qwen2.5-1.5B-Instruct 68% 25% 44% 59% 55% 60%
Phi-4-mini-instruct 60% 29% 44% 48% 48% 50%

Cite This Work

@inproceedings{zawalski2026detecting,
  title={Detecting Data Contamination in {LLMs} via In-Context Learning},
  author={Zawalski, Micha{\l} and Boubdir, Meriem and Ba{\l}azy, Klaudia and Nushi, Besmira and Ribalta, Pablo},
  booktitle={International Conference on Learning Representations (ICLR)},
  year={2026},
  url={https://openreview.net/forum?id=YlpaaYxx4t}
}